
100 Stock Market Terms Every Investor and Trader Must Know
A complete, practical guide to stock market terminology for beginners, investors and traders.
FREE EDUCATIONAL RESOURCE
The stock market has its own language. Whether you are a beginner, investor, trader or student of financial markets, understanding stock market terminology is an essential first step.
This guide explains 100 important stock market terms in simple language, with examples and context relevant to the Indian market. Use the contents below to jump directly to a topic.
1. Stock Market Basics
1. Stock Market
A marketplace where shares of publicly listed companies and other securities are bought and sold. In India, NSE and BSE are the major stock exchanges.
2. Share
A unit of ownership in a company. Buying a share makes you a shareholder and gives you an ownership interest in that company.
3. Stock Exchange
An organised marketplace where securities are listed and traded under prescribed rules and regulations.
4. NSE (National Stock Exchange)
One of India’s leading stock exchanges. Its benchmark index is the Nifty 50.
5. BSE (Bombay Stock Exchange)
One of India’s leading stock exchanges and the oldest stock exchange in Asia. Its benchmark index is the Sensex.
6. Nifty 50
A benchmark index comprising 50 selected companies listed on NSE. It is widely used to gauge the performance of a segment of the Indian equity market.
7. Sensex
The benchmark index of BSE, comprising 30 selected companies.
8. Bull Market
A market phase characterised by a sustained upward trend in prices and generally positive investor sentiment.
9. Bear Market
A market phase characterised by a sustained decline in prices and generally negative investor sentiment.
10. Market Capitalisation
The total market value of a company’s outstanding shares. Formula: current share price × number of outstanding shares.
11. Large-Cap Stocks
Stocks of companies with relatively large market capitalisations, generally established businesses with substantial market presence.
12. Mid-Cap Stocks
Stocks of companies that fall between large-cap and small-cap categories by market capitalisation.
13. Small-Cap Stocks
Stocks of relatively smaller companies. They may offer growth opportunities but can also involve higher volatility and risk.
14. IPO (Initial Public Offering)
The process through which a company offers shares to the public for the first time and seeks listing on a stock exchange.
15. Liquidity
How easily a security can be bought or sold without causing a substantial change in its price.
2. Trading and Investment Terminology
16. Delivery Trading
Buying shares and taking delivery into a demat account, rather than closing the position within the same trading session.
17. Intraday Trading
Buying and selling a security within the same trading day. Positions are generally closed before the session ends.
18. Positional Trading
Holding a market position for several days, weeks or months, depending on the strategy and market outlook.
19. Swing Trading
A trading approach that seeks to capture price swings over periods typically ranging from a few days to several weeks.
20. Scalping
A short-term trading approach that seeks to capture small price movements through frequent trades.
21. Long Position
A position created by buying a security with the expectation that its price will rise.
22. Short Selling
Selling a security first with the intention of buying it back later at a lower price. In India’s cash market, short selling is generally subject to intraday restrictions.
23. Portfolio
A collection of investments held by an individual or institution, such as shares, mutual funds, bonds and other securities.
24. Diversification
Spreading investments across securities, sectors or asset classes to reduce concentration risk.
25. Brokerage
A fee charged by a broker for executing transactions on behalf of a client.
26. Demat Account
An account that holds shares and other eligible securities in electronic form.
27. Trading Account
An account used to place buy and sell orders through a stockbroker.
28. Settlement
The process through which securities and funds are transferred after a trade. India’s standard equity settlement cycle is T+1 for most securities.
29. Dividend
A distribution of a company’s profits or reserves to shareholders, subject to the company’s decision and applicable rules.
30. Bonus Shares
Additional shares issued to existing shareholders without a separate payment, in proportion to their existing holdings.
3. Price and Market Movement Terms
31. Opening Price
The price at which a security begins trading during a session, as determined by the exchange’s process.
32. Closing Price
The official closing price determined under the exchange’s prescribed methodology.
33. High
The highest traded price of a security during a specified period.
34. Low
The lowest traded price of a security during a specified period.
35. Bid Price
The highest price a prospective buyer is currently willing to pay.
36. Ask Price
The lowest price at which a prospective seller is currently willing to sell.
37. Spread
The difference between the best available ask price and the best available bid price.
38. Volume
The number of shares or contracts traded during a specified period. For example, 20 lakh shares traded in a session represents volume of 20 lakh shares.
39. Volatility
The extent and speed of price fluctuations in a financial instrument. Higher volatility means prices are changing more sharply.
40. Market Trend
The general direction of prices over a period. A trend may be upward, downward or sideways.
4. Technical Analysis Terms
41. Technical Analysis
The study of historical price, volume and market behaviour to identify trends and potential trading opportunities.
42. Candlestick
A chart representation showing the opening, closing, highest and lowest prices for a chosen time period.
43. Support
A price area where buying interest may emerge and potentially slow or halt a decline.
44. Resistance
A price area where selling pressure may emerge and potentially slow or halt an advance.
45. Breakout
A move beyond an established resistance level or trading range, potentially signalling a change in market behaviour.
46. Breakdown
A move below an established support level or trading range, potentially signalling increasing selling pressure.
47. Moving Average
An indicator that averages prices over a specified number of periods to smooth fluctuations and help identify trends.
48. Simple Moving Average (SMA)
The arithmetic average of prices over a specified number of periods.
49. Exponential Moving Average (EMA)
A moving average that gives greater weight to recent prices and therefore responds more quickly to recent changes.
50. RSI (Relative Strength Index)
A momentum indicator developed by J. Welles Wilder. It ranges from 0 to 100; readings above 70 or below 30 are often watched, but are not automatic trading signals.
51. MACD
Moving Average Convergence Divergence, a trend-following momentum indicator based on the relationship between exponential moving averages.
52. Bollinger Bands
A volatility indicator consisting of a moving average and upper and lower bands typically set using standard deviations.
53. Fibonacci Retracement
A charting tool used to identify possible correction levels. Commonly watched levels include 38.2%, 50% and 61.8%.
54. Trendline
A straight line drawn across significant swing highs or swing lows to help visualise the direction of a trend.
55. Chart Pattern
A recognisable price formation, such as a Head and Shoulders, Double Top, Double Bottom or Triangle.
56. Doji
A candlestick in which the opening and closing prices are very close, often reflecting indecision during that period.
57. Hammer
A candlestick with a small real body and a long lower shadow. After a decline, it may indicate that buyers are becoming more active.
58. Engulfing Pattern
A two-candle formation in which the second real body covers the first real body; it may signal a change in short-term sentiment.
59. Gap Up
A session opening materially above the previous session’s closing price, leaving a gap on the chart.
60. Gap Down
A session opening materially below the previous session’s closing price, leaving a gap on the chart.
61. Breakout Trading
A strategy that seeks to enter when price moves beyond a defined range or important technical level.
62. Price Action
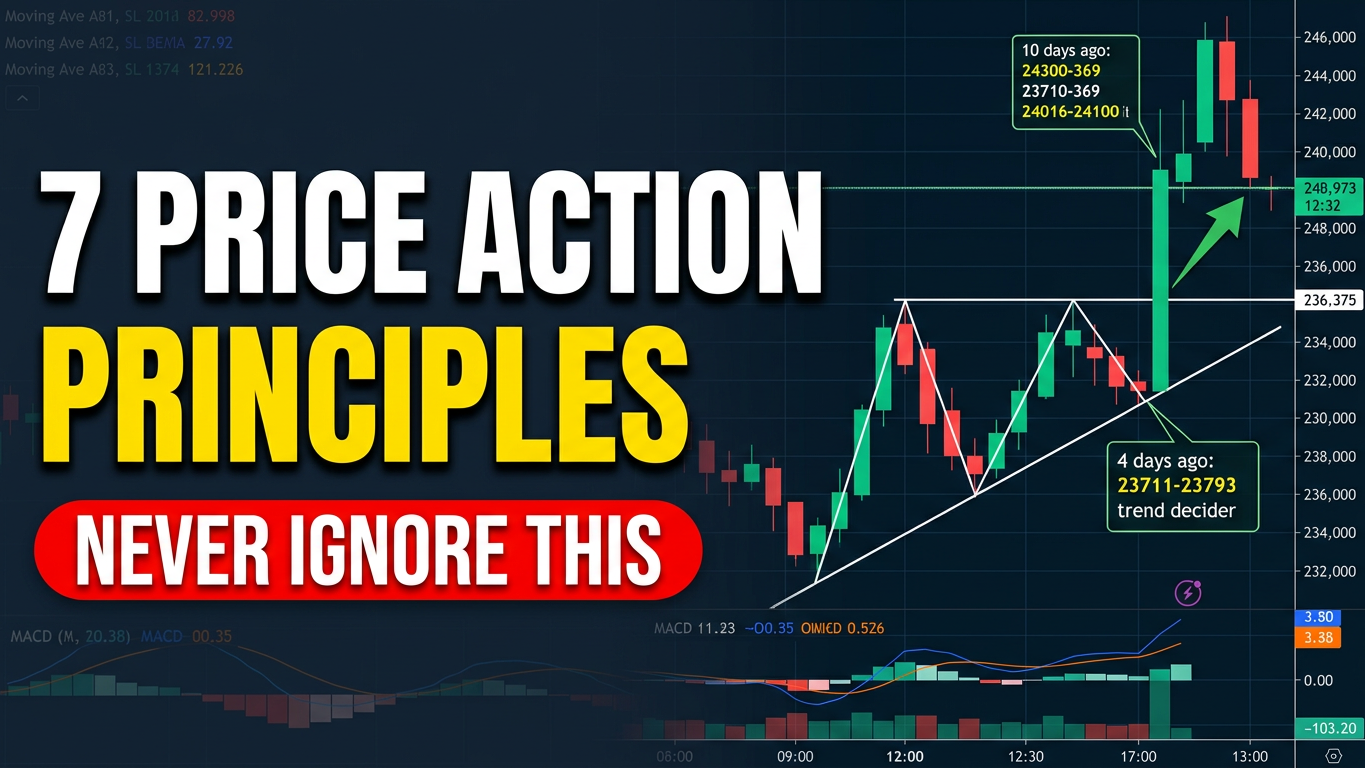
The analysis of price movement itself, including candles, swing highs and lows, support, resistance and market structure.
63. Relative Strength
A comparison of one security’s performance with another security, index or benchmark over a chosen period.
64. Retracement
A temporary move against the prevailing trend, such as a decline within a broader uptrend.
65. Reversal
A change in the prevailing direction of price, such as a shift from an uptrend to a downtrend.
5. Derivatives and Options Trading
66. Derivatives
Financial contracts whose value is linked to an underlying asset, such as a share, index, commodity or currency.
67. Futures Contract
An exchange-traded contract to buy or sell an underlying asset at a specified price on a specified future date.
68. Options Contract
A contract giving the buyer a right, but not an obligation, to buy or sell an underlying asset under specified terms.
69. Call Option
An option that gives its buyer the right to buy the underlying asset at the strike price, subject to the contract terms.
70. Put Option
An option that gives its buyer the right to sell the underlying asset at the strike price, subject to the contract terms.
71. Strike Price
The predetermined price at which the underlying asset may be bought or sold under an options contract.
72. Premium
The price paid by an option buyer to purchase the option; it is received by the option seller.
73. Expiry Date
The date on which a derivatives contract expires under its contract specifications.
74. Open Interest (OI)
The total number of outstanding derivatives contracts that have not been closed, exercised or settled.
75. Lot Size
The specified quantity of the underlying asset represented by one derivatives contract.
76. In The Money (ITM)
An option with intrinsic value. A call is ITM when the underlying price is above its strike; a put is ITM when the underlying price is below its strike.
77. At The Money (ATM)
An option whose strike price is approximately equal to the current price of the underlying asset.
78. Out of The Money (OTM)
An option with no intrinsic value. A call is OTM when the underlying price is below its strike; a put is OTM when it is above its strike.
79. Option Chain
A table showing available call and put contracts across strike prices, often including premiums, volume and open interest.
80. Implied Volatility (IV)
A value derived from option prices that reflects the market’s implied expectation of future price fluctuations.
81. Delta
An estimate of how much an option’s premium may change for a one-unit change in the underlying price, all else being equal.
82. Gamma
A measure of how quickly an option’s Delta changes as the underlying price changes.
83. Theta
A measure of the estimated impact of time passing on an option’s premium, all else being equal.
84. Vega
A measure of an option premium’s sensitivity to changes in implied volatility.
85. Hedging
A risk-management approach that uses an offsetting position to reduce exposure to an adverse market move.
6. Fundamental Analysis and Financial Ratios
86. Fundamental Analysis
The evaluation of a company’s business, financial statements, management, industry and economic conditions to assess its financial strength and value.
87. Earnings Per Share (EPS)
The portion of a company’s profit attributable to each ordinary share. It is generally calculated using weighted-average shares.
88. Price-to-Earnings Ratio (P/E)
The share price divided by earnings per share. It indicates how the market values a company’s earnings.
89. Price-to-Book Ratio (P/B)
The market price per share divided by book value per share.
90. Return on Equity (ROE)
A measure of profitability relative to shareholders’ equity, commonly calculated as profit after tax divided by average equity.
91. Return on Capital Employed (ROCE)
A measure of how efficiently a business generates operating profit from capital employed; commonly EBIT divided by capital employed.
92. Debt-to-Equity Ratio
A measure comparing a company’s debt with shareholders’ equity. The precise definition of debt can vary between analyses.
93. Book Value
The accounting value of a company’s assets minus its liabilities, based on its balance sheet.
94. Face Value
The nominal value assigned to a share by the issuing company, also called par value.
95. Earnings Before Interest and Tax (EBIT)
A measure of earnings before interest expense and income tax, often used to assess operating profitability.
7. Risk Management and Investment Psychology
96. Stop Loss
An order or predefined exit level intended to limit a trade’s loss. The execution price may differ from the trigger price, especially in fast markets.
97. Risk-Reward Ratio
A comparison of the amount at risk with the potential profit. For example, risking ₹1,000 for a potential ₹3,000 gain represents a 1:3 risk-reward ratio.
98. Position Sizing
Determining how much capital or how many shares or contracts to allocate to a trade based on account size and acceptable risk.
99. Trading Psychology
The emotional and behavioural factors that influence trading decisions, including fear, greed, patience, confidence and discipline.
100. Capital Preservation
The practice of protecting investment capital through risk control, diversification and disciplined decision-making.
Frequently Asked Questions
What are the most important stock market terms for beginners?
Start with shares, stock exchanges, Nifty, Sensex, market capitalisation, liquidity, volume, support, resistance, stop loss and risk-reward ratio.
What is the difference between trading and investing?
Trading generally focuses on shorter-term price movements. Investing usually involves holding assets for longer periods based on business performance, valuation and financial goals.
Which technical analysis terms should a beginner learn first?
Begin with candlesticks, trend, support, resistance, volume, moving averages and price action. Then study indicators such as RSI and MACD.
What is the difference between NSE and BSE?
NSE and BSE are two major Indian stock exchanges. Nifty 50 is associated with NSE and Sensex is the benchmark index of BSE.
What is the difference between a Call Option and a Put Option?
A Call Option gives its buyer the right to buy the underlying asset at the strike price. A Put Option gives its buyer the right to sell it at the strike price.
Can beginners learn technical analysis?
Yes. Beginners can study charts, price trends, candlesticks, support and resistance, volume and risk management. Practice and disciplined learning are important.
Why is risk management important in trading?
Risk management helps control potential losses, set position sizes and protect capital. It cannot eliminate market risk or guarantee profits.
How long does it take to learn the stock market?
Basic concepts can be learned relatively quickly, but developing analytical skills, experience and trading discipline requires continued study and practice.
Continue Your Stock Market Learning with JMC Finance Institute
Understanding terminology is only the beginning. Build your knowledge through structured learning, practical examples and disciplined study.
Explore our Technical Analysis Course
© JMC Finance Institute · All Rights Reserved
Recent Post
JMC Finance Institute Core Principles of Technical Analysis Lesson No. [...]

Welcome to JMC Finance — a place where financial knowledge [...]